React Developer Tools
Debug applications by inspecting component trees, editing props and state on the fly, and recording performance information with the profiler.
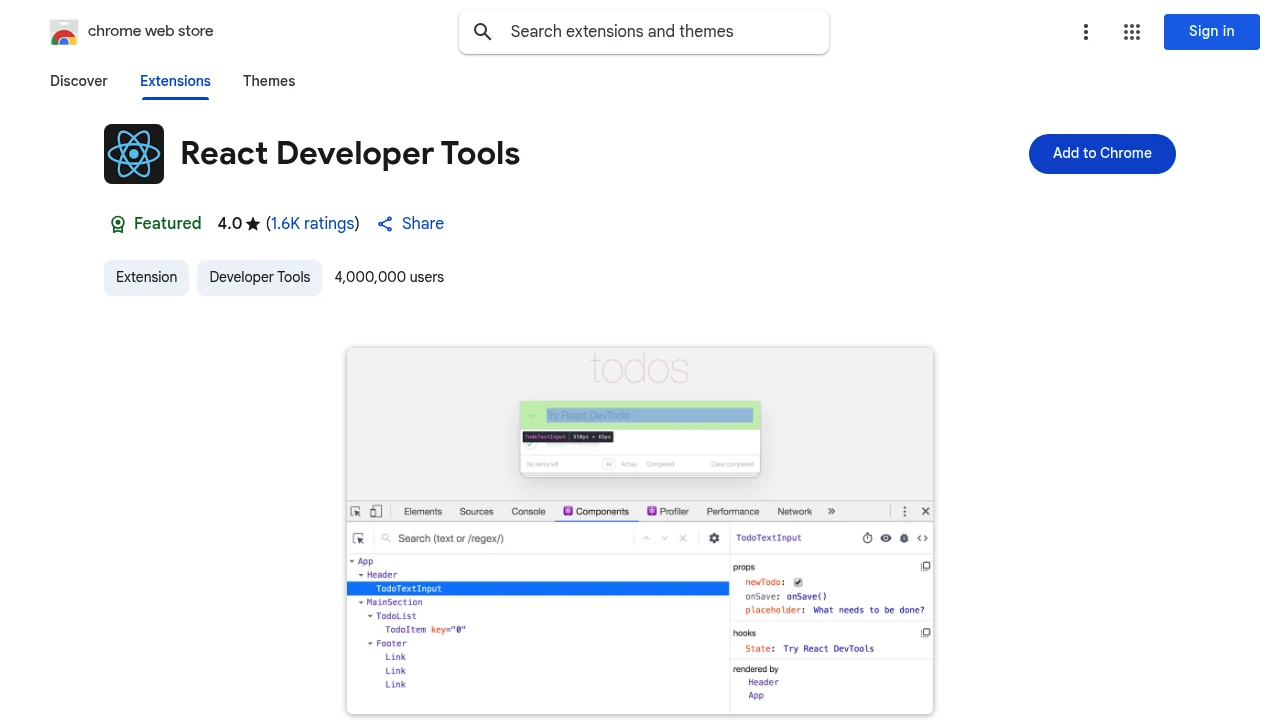
This browser extension adds powerful debugging capabilities to your Chrome Developer Tools specifically for the React JavaScript library. It introduces two new tabs, "Components ⚛" and "Profiler ⚛", designed to give you deep insight into your application's structure and performance.
The Components tab provides a complete view of the React component hierarchy rendered on the page. You can:
- Select any component in the tree to inspect and edit its props and state in real-time.
- Navigate the component's ancestry using the breadcrumbs.
- Easily find a component by inspecting a DOM element in the standard Elements tab and then switching over.
The Profiler tab is an indispensable tool for optimization. It allows you to record performance data as your application runs, helping you identify and resolve performance bottlenecks. This extension is fully open source and does not transmit any data remotely, respecting your privacy and security.
Categories:
Tags:
Similar to React Developer Tools